Let’s face it, tracking DeFi returns is messy. Here’s how to do it properly.
Learn how to apply cost basis to DeFi assets and why Zerion looks at both Investment Return and Return vs HODLing.


Learn how to apply cost basis to DeFi assets and why Zerion looks at both Investment Return and Return vs HODLing.
It’s no secret that accurately tracking your DeFi investments is virtually impossible. The DeFi ecosystem is nascent, and we’ve previously discussed how fragmentation across protocols and dApps makes fetching accurate data the stuff of dreams. Just take a look at the same address tracked within a 5-minute window on five different DeFi interfaces:
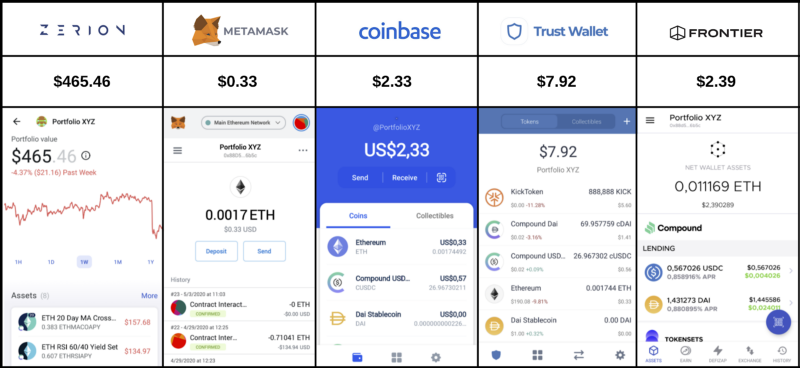
These differences are not trivial. Interfaces that are connected to more protocols invariably show more accurate figures — but from a user perspective, finding precise portfolio data is only half the problem.
What’s often overlooked is how portfolio returns are presented. In this article, we’ll look at a few ways to evaluate the performance of a DeFi portfolio and discuss why some methods work better than others.
Understanding cost basis
Let’s start with a simple approach to evaluating the performance of an investment:
In finance, cost basis is the purchase price of an asset, commonly used to calculate the capital gains rate (the difference between the cost basis and current market value) for tax purposes. With DeFi assets, calculating the true investment return in this way can become tricky depending on which base currency you use.
For example, what happens if you invest 10 ETH at $130 per ETH in a liquidity pool at the beginning of the tax year, then take out your investment at the end of the tax year when the price of ETH is $200? You should receive $2,000 plus the amount you made in trading fees — let’s say that’s $100. The cost basis for your investment is $1,300 and the capital gains would be $2,100 — $1,300 = $800.
Now, how helpful is this figure when deciding whether the investment was actually worth it? What would have happened if instead the price of ETH dropped to $100 and you made only $50 in trading fees for the year? Your entire investment would be worth $1,050 and your capital loss would be $1,300 — $1,050 = $250.
Supposedly, the investment would have been a bad move the second time round. However, if we denominate returns in ETH, you’d have made the exact same gain in both cases: 0.5 ETH.
This highlights a few problems with simply looking at investment returns when evaluating your DeFi portfolio:
- Capital gains don’t give you a counterfactual. They tell you how much you’ve earned or lost, but they don’t tell you how much you would have earned or lost in comparison had that money (in this case, an ERC-20 token) simply been held — or as it’s known in crypto, “HODLd”.
- Different base currencies lead to different conclusions. In the example above, it appears at face value that the second investment performed worse. In fact, the ETH gains were identical. The broader crypto market may have suffered losses in USD value, however the investor would still be left with the same amount of ETH to reinvest in other assets.
Understanding these nuances can greatly affect your decisions as an investor. It’s important to be able to decouple your investment performance from the general price movement of the market. This is why Zerion aims to provide not only precise portfolio balances but also useful metrics that reduce the noise and help you make better decisions.
Applying cost basis to DeFi: Zerion’s approach
Let’s take a look at a specific example of investing in liquidity pools. We’re interested in three metrics:
- Investment Return: the difference between the initial investment in a liquidity pool and its current worth
- HODLing Return: the difference between the current price of the underlying assets in the liquidity pool and their price at the time the investment was made i.e. how much would have been earned on price movement alone if the assets had not been invested?
- Return vs HODLing: the difference between the investment return and HODLing return. To an investor, this is the most important figure because it tells you whether the investment was actually worth it in comparison to simply HODLing the assets.
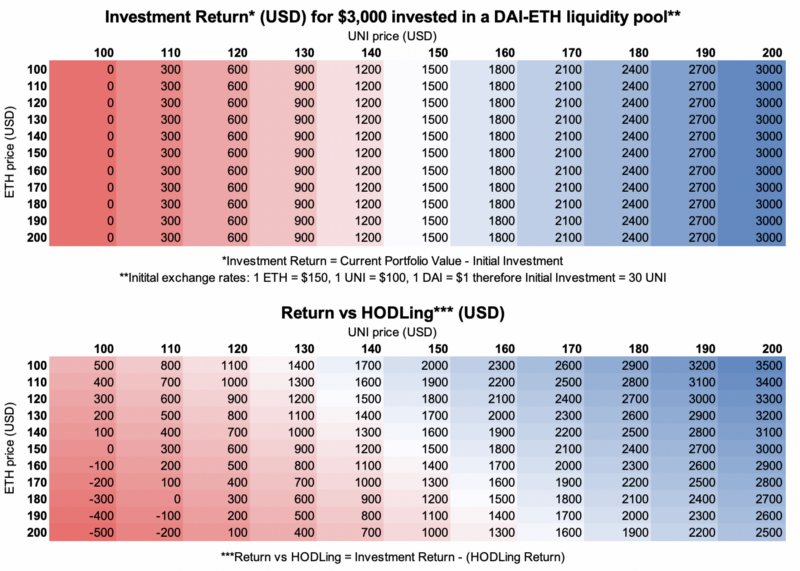
The tables below present two of these metrics for $3000 invested in a Uniswap DAI-ETH liquidity pool at initial exchange rates of 1 ETH = $150, 1 UNI = $100 and 1 DAI = $1. Remember, in practice this means that 10 ETH + 1500 DAI gets put into the pool (for a more detailed breakdown of how liquidity pools work, check out our deep dive.) We’ll assume that the DAI rate remains constant throughout the period.
The vertical axis shows variations in ETH prices and the horizontal axis shows variations in the UNI token price, both denominated in USD. Looking at a particular cell tells you what the return would be at those rates, ignoring any trading fees earned. The Return vs HODLing table illustrates under which scenarios investing in the liquidity pool would have been more lucrative than simply holding the ETH and DAI.
Going through a Uniswap Liquidity Pool example
How might our calculations change with a more complex set of actions? Let’s see what happens to the same initial investment when you add and subtract from the pool at different exchange rates:
Step 1: Initial investment = $3000 or 30 UNI or 20 ETH
Step 2: You receive 10 UNI from a friend (1 ETH = $180, 1 DAI = $1 and 1 UNI = $120)
- Total amount invested: $3000 + (10 UNI * $120) = $4200 or 23.33 ETH
- Total taken out: $0
- Current portfolio value: $4800 or 40 UNI or 26.66 ETH
Step 3: You sell 20 UNI (1 ETH = $160, 1 DAI = $1, 1 UNI = $120)
- Total amount invested: $3000 + (10 UNI * $120) = $4200 or 23.33 ETH
- Total taken out: 20 UNI * $120 = $2400 or 15 ETH
- Current portfolio value: (40 UNI * $120) — $2,400 = $2400 or 20 UNI or 15 ETH
Here it’s important to remember that Uniswap pools assume a constant 1:1 ratio between each token in the underlying ETH + ERC20 asset pair. This means that sending or receiving UNI tokens will add or subtract exactly half the UNI amount for each token in the asset pair, at the current exchange rate.
Step 4: You send 10 UNI back to your friend (1 ETH = $140, 1 DAI = $1, 1 UNI = $110)
- Total amount invested: $3000 + (10 UNI * $120) = $4200 or 23.33 ETH
- Total amount taken out: $2400 + (10 UNI * $110) = $3500 or 25 ETH
- Current portfolio value: (20 UNI * $110) — (10 UNI * $110) = $1100 or 10 UNI or 7.86 ETH
At the end of the investment period, let’s say the exchange rates are: 1 ETH = $200, 1 DAI = $1, 1 UNI = $140. Therefore the current portfolio value is now 10 UNI * 140 = $1400 or 7 ETH. Here’s how we calculate the three metrics of interest:
- Investment return (IR) is the remaining balance + total taken out — total invested ($) = $1400 + $3300 — $4200 = $500 or 2.5 ETH
- HODLing return (HR) is the total invested (ETH) * $200 — total invested ($) = $4666.67 — $4200 = $466.67 or 2.33 ETH
- Investment vs HODLing return is (IR) — (HR) = $500–466.67 = $33.33 or 0.17 ETH
Through this lens, although the investment yielded $500, it was worth $33.33 more than HODLing.
🚀 Conclusion
It’s crucial to look at the right numbers when evaluating your investment performance, which is why Zerion lets you view your returns in ETH and provides metrics such as Return vs. HODLing. Ready to start putting your DeFi assets to work?