Solana Token Price Charts, Now in Zerion API
Everything about Zerion API’s Solana token price charts.

When a Solana wallet connects, users expect price charts to load instantly. But adding charts often means managing several APIs. This becomes even more complex with several chains. But not if you use Zerion API. The fungible charts endpoint uses the same schema for Solana, Ethereum, and 24+ EVM chains. In this post, you’ll learn everything about Zerion API’s Solana token price charts.
TL;DR:
Use Zerion API’s GET /v1/fungibles/{fungible_id}/charts/{chart_period} for Solana tokens to fetch normalized price series for drop-in sparklines and time-series charts.
What is Zerion API?
Zerion API is a production-ready wallet data platform that gives you instant, normalized access to multi-chain portfolio state: tokens, DeFi positions, NFTs, transactions, PnL, and price charts. Zerion uses one auth and the same schema across Solana and EVM. It’s built for high-scale consumer apps to ship fast experiences, eliminate token-coverage gaps, and keep UIs snappy without running your own indexers.
The API offers the same data you see in Zerion’s Solana wallet and web app. It's also used by companies like Kraken, Infinex, OpenSea, and many others.
Fungibles chart endpoint overview
Zerion API offers a single endpoint for token price charts for both Ethereum / EVM chains and Solana.
GET https://api.zerion.io/v1/fungibles/{fungible_id}/charts/{chart_period}?currency=usd
{fungible_id}– the fungible asset ID, the same one you can get in Zerion’s /positions and other endpoints{chart_period}– the prices can be returned for hour, day, week, month, year, or maximum (usually since the token launched)currency– normalize prices in ETH, BTC, USD, or major fiat currencies
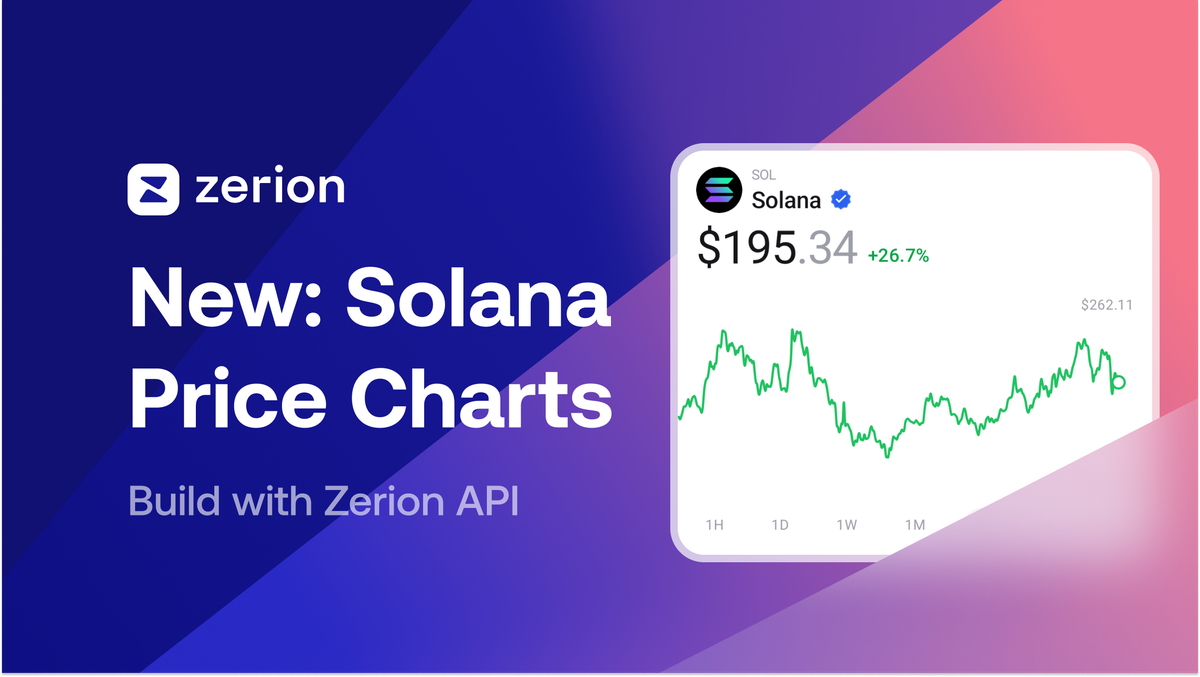
The response is given as a timeseries with unix_seconds and prices. Here is an example for a day chart with prices for every 5 minutes.
{
  "links": {
    "self": "https://api.zerion.io/v1/fungibles/11111111111111111111111111111111/charts/day?currency=usd"
  },
  "data": {
    "type": "fungible_charts",
    "id": "11111111111111111111111111111111-day",
    "attributes": {
      "begin_at": "2025-10-13T13:50:00Z",
      "end_at": "2025-10-14T13:50:00Z",
      "stats": {
        "first": 194.22407550479997,
        "min": 192.21674282849997,
        "avg": 201.49800676928095,
        "max": 210.7062787433,
        "last": 193.34017981059998
      },
      "points": [
        [
          1760363400,
          194.22407550479997
        ],
        [
          1760363700,
          195.1531912116
        ]
        // ... [unix_seconds, price]
      ]
    }
  }
}
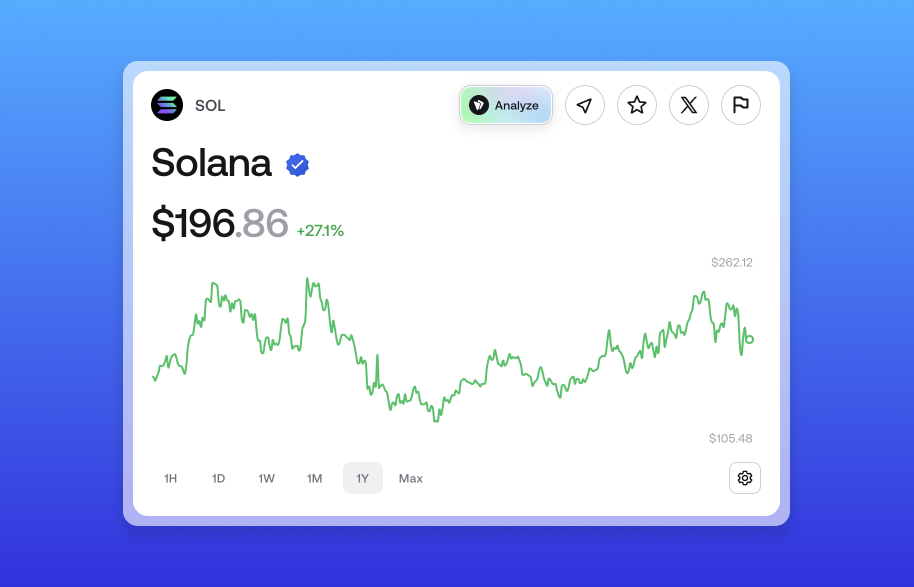
Here is how the price chart looks in the Zerion web app.
Where to use fungible price charts?
The endpoint returns standard JSON data. So it's compatible with virtually any modern programming language or framework that can make HTTP requests and parse JSON responses.
How to find the right fungible_id?
You can use the Zerion fungibles endpoints to search for a token and take the returned fungible_id into the charts endpoint. Zerion API keeps the same ID across Solana and EVM paths to avoid schema forks.
Ship with Zerion
Zerion API’s Solana support for fungible token price charts means you can deliver the same fast, reliable chart UX across Solana and EVM. With one endpoint and one schema, you can reduce the integration time even further.